This report gives operators a deeper understanding of how many calls their phone lines likely handle at any given time, what guests typically want when they call, and the hidden revenue opportunities associated with overlooking this essential channel. More importantly, it outlines practical ways to capture incremental revenue and improve guest satisfaction by embracing a modern phone strategy.


In these markets, brunch is a high-stakes service period that drives volume and repeat guests. People love brunch so much in these cities that it’s practically an institution. Unsurprisingly, the data shows that Washington, D.C. is the undisputed king (queen?) of brunch. If you’ve ever spent some time in D.C., you know that brunch is a way of life.
In second place, the high volume of brunch-related calls in New York City also suggests a culture where reservations and waitlists are critical to maximizing covers during weekend service. In third place is Miami Beach, adding a coastal flair, reflecting the city’s vibrant hospitality scene and its tourist-heavy brunch traffic.
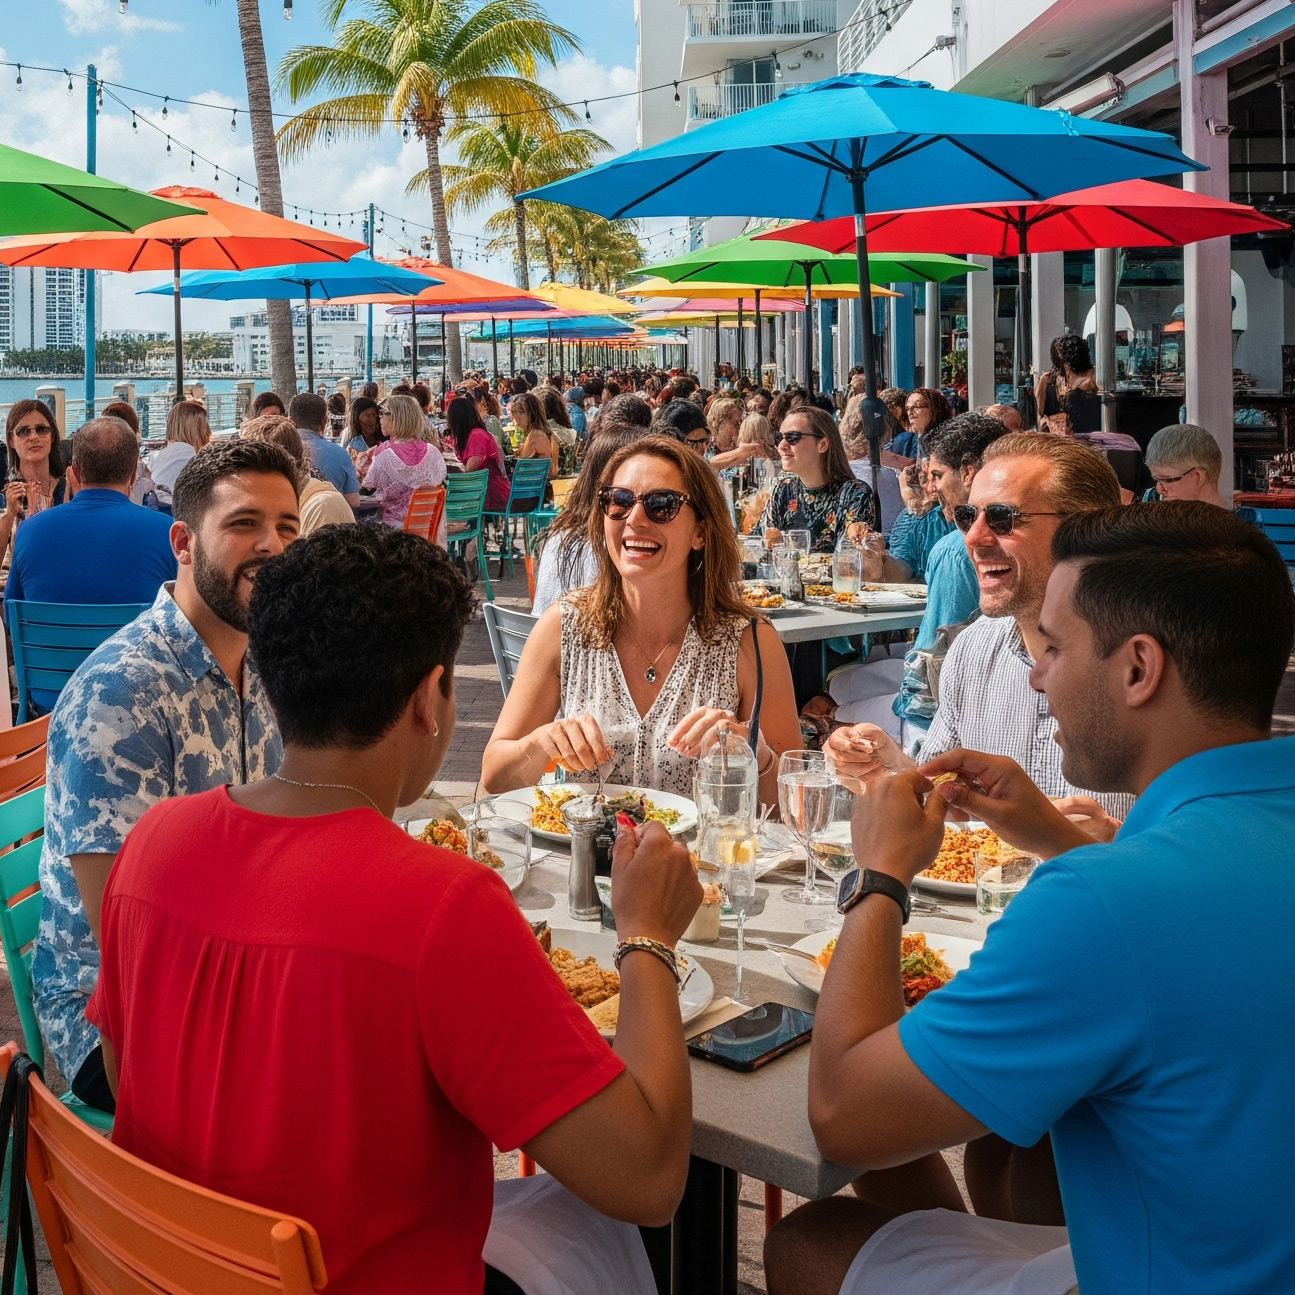
Inquiries about patio seating peak in sunny, coastal cities, so it’s no surprise that Florida snagged two of the top spots for this call topic. Fort Lauderdale and Tampa suggest a climate-driven demand for outdoor ambiance, while New York’s presence hints at urban diners’ growing preference for al fresco experiences, especially in a post-pandemic era.
Bonus: When we dig deeper, callers were 23% more likely to book if a restaurant offered outdoor seating. Something to keep in mind if you’re on the fence during the development of your next concept!

In a city where hospitality is high-touch and fast-paced, New York leads the nation in guests calling to confirm accommodations and policies for their beloved fur babies. This could reflect a rising demand for pet-inclusive dining in a city famous for its dense, walkable neighborhoods.
In second place, we see Seattle, another city known for its outdoorsy, pet-loving population. And third in the ranking, Miami’s inclusion points to the city’s laid-back, lifestyle-centric approach to hospitality. This signals a growing demand for pet-friendly dining policies and accommodations.
This metric captures the average number of calls restaurants receive each month. Understanding the volume of these calls is crucial because it gives a sense of how many calls your staff must manage. Every call should be viewed as an opportunity, as you only get one chance to make a first impression.

According to a study, nearly 70% of consumers prefer to communicate via phone more than digital channels. Keep in mind that these are averages, and call volumes can swing lower or higher. In addition to digital channels, the truth is that guests are still calling your restaurant.
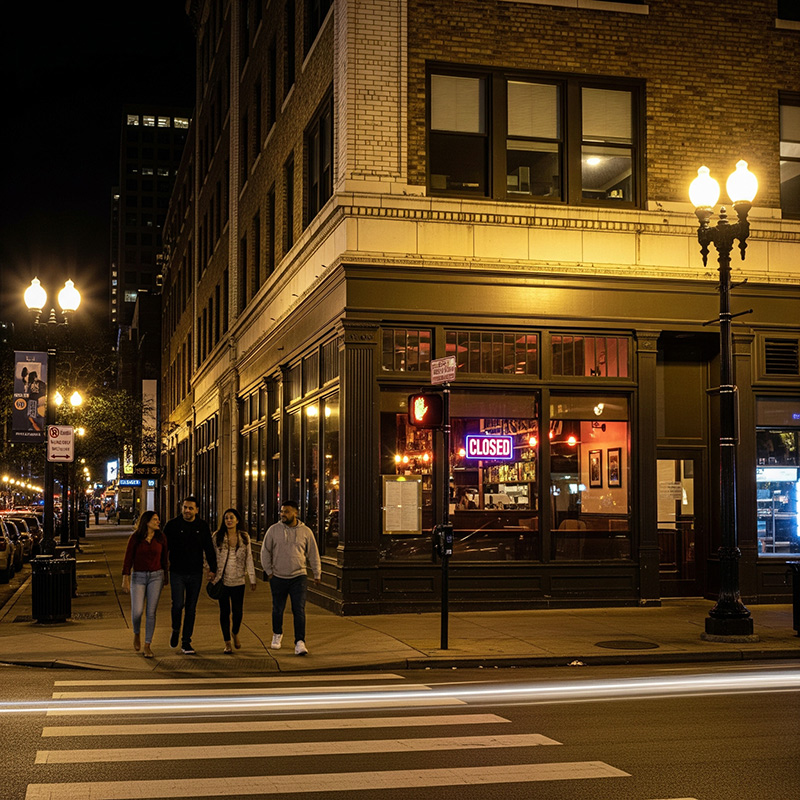
Calls that occur outside regular business hours often represent unmet demand. It’s not realistic to have staff available to answer phones 24/7, but the fact remains that guests continue to call. Think about the compounding effect over a month. Using a previous example of $100 average reservations, apply that roughly 14% for after-hours calls to 100 reservation attempts. That’s $1,400 in 14 reservations that you likely can’t capture.
Guests aren’t just calling during dinner rush. They call when they plan: mid-afternoon, late at night, or Sunday mornings. If no one’s there to pick up, they’ll book somewhere else. Whether these callers seek reservations or have other inquiries, after-hours calls often result in missed opportunities and revenue loss. Surprisingly, the data also reveals that 20% of reservations occur outside of business hours. In short, restaurants have a chance to capitalize on this unmet demand for revenue growth.
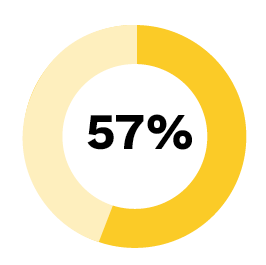
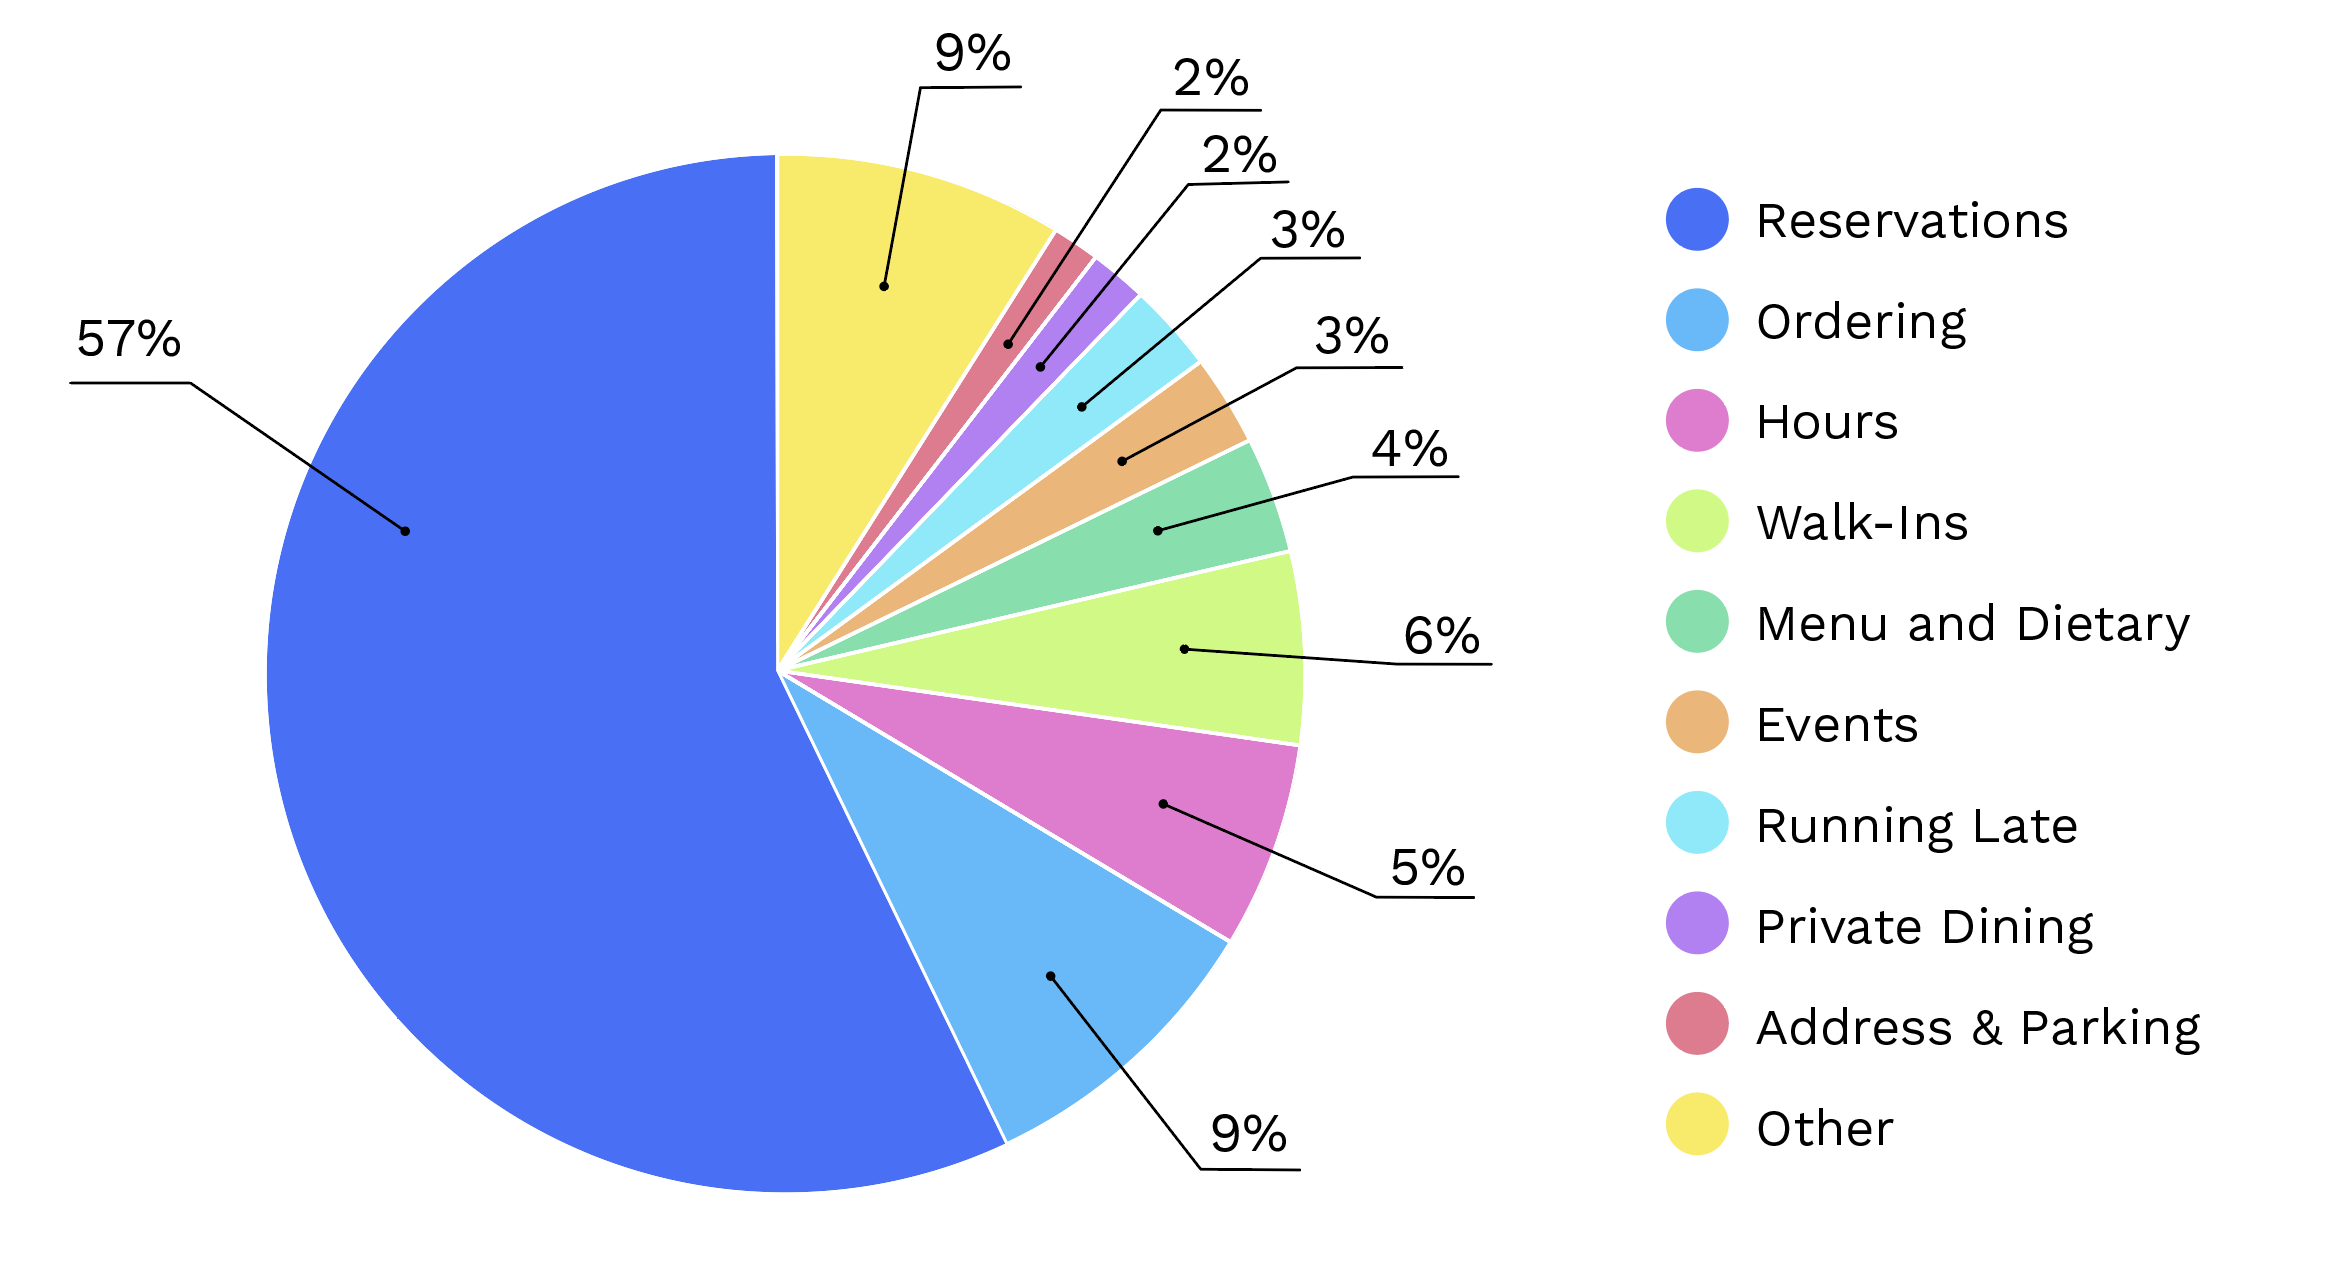
We know that over half of all restaurant phone calls are about reservations (57%). If we apply that percentage to both coinciding and after-hours call volumes, we can isolate the most revenue-relevant opportunities: